HORMEL FOODS CORP /DE/ (HRL)
About HORMEL FOODS CORP /DE/
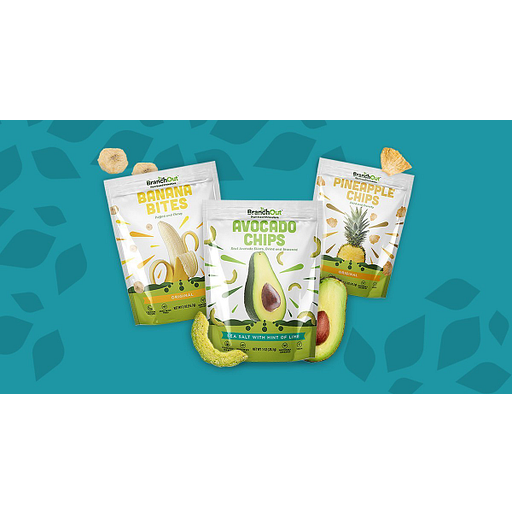
Historically meat-focused, Hormel Foods broadened its lineup to include other protein offerings and became a branded food company. The firm sells its wares through multiple channels, including US retail (61.6% of fiscal 2025 sales), US foodservice (32.6%), and international (5.9%). By product, 73% of fiscal 2025 sales were from perishable food and 27% from shelf-stable. Major brands include Hormel, Spam, Jennie-O, Columbus, Applegate, Planters, and Skippy. Many of these hold the number one or two market share in their respective categories.
This profile is unclaimed. An authorized representative can claim it to add details and earn the Verified badge.
American Credentials
Each credential is independently reviewed before it’s awarded · last reviewed Jun 9, 2026. How this is verified →
Financial summary
- Revenue FY2017
- $9.2B
- Net income
- $478.2M
- Total assets
- $13.4B
- Market cap
- $13.0B
- Gross margin
- 15.6%
- Operating margin
- 5.9%
- Net margin
- 3.9%
Source: SEC EDGAR · updated Jun 7, 2026
Revenue & profit trend
Financial statements
Income statement
- Revenue
- $12.1B
- Cost of revenue
- $10.2B
- Gross profit
- $1.9B
- Operating expenses
- $1.2B
- Operating income
- $718.6M
- Income tax
- $185.7M
- Net income
- $477.8M
- EPS (basic)
- $0.87
- EPS (diluted)
- $0.87
Balance sheet
- Total assets
- $13.4B
- Current assets
- $3.4B
- Total liabilities
- $5.5B
- Current liabilities
- $1.4B
- Shareholders’ equity
- $7.9B
Cash flow
- Operating cash flow
- $845.3M
- Investing cash flow
- -$298.6M
- Financing cash flow
- -$614.0M
- Net cash flow
- -$71.2M
Statements via Polygon.io (SEC filings)
15-minute delayed · data by Polygon.io
Past year · hover for prices
52-week range
- Market cap
- $13.0B
- P/E ratio
- 29.1
- EPS (diluted)
- $0.87
- Dividend yield
- 4.62%
- Shares outstanding
- 513.6M
- Open
- —
- Day range
- –
- Prev close
- —
- Volume
- —
- IPO date
- Jun 1, 1972
Hormel Foods Corp /DE/ (HRL) Stock Price
- Profitable — net income of $478.2M in FY2017.
- Revenue grew 6% from FY2021 to FY2025.
- Gross margin of 15.6%, net margin 3.9%.
- Trading 20% below its 52-week high.
- Pays a dividend yielding about 4.62% annually.
- Valued at a price-to-earnings (P/E) ratio of 29.1.
Automatically generated from public filings and market data. Informational only — not investment advice or a recommendation to buy or sell any security.
Peers & competitors
No reviews yet. Be the first to review HORMEL FOODS CORP /DE/.
Write a review
News about HORMEL FOODS CORP /DE/
News & sentiment via Polygon.io
Hormel Foods Corp /DE/: frequently asked questions
Is Hormel Foods Corp /DE/ an American company?
Yes — Hormel Foods Corp /DE/ is an American company headquartered in Austin, Minnesota. Its American-origin credentials have been independently reviewed and verified by americancompanies.com.
Where is Hormel Foods Corp /DE/ headquartered?
Hormel Foods Corp /DE/ is headquartered in Austin, Minnesota, United States.
Is Hormel Foods Corp /DE/ publicly traded?
Yes — Hormel Foods Corp /DE/ is a publicly traded company. Its stock trades under the ticker symbol HRL on the NYSE.
What does Hormel Foods Corp /DE/ do?
Hormel Foods Corp /DE/ is an American Meat & Seafood company in the Food & Beverage sector.