NEXTERA ENERGY INC (NEE)
About NEXTERA ENERGY INC
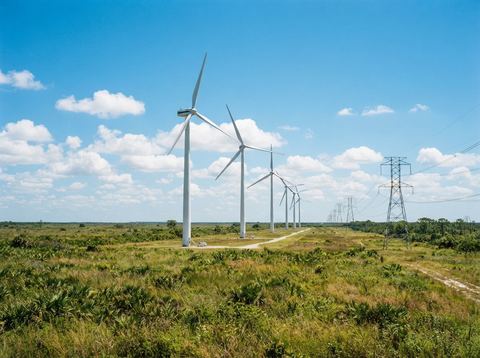
NextEra Energy's regulated utility, Florida Power & Light, is the largest rate-regulated utility in Florida. The utility distributes power to over 6 million customer accounts in Florida and owns 36 gigawatts of generation. FP&L contributes roughly 70% of NextEra's consolidated operating earnings. NextEra Energy Resources, the renewable energy segment, generates and sells power throughout the United States and Canada with nearly 40 GW of generation capacity, including natural gas, nuclear, wind, and solar.
This profile is unclaimed. An authorized representative can claim it to add details and earn the Verified badge.
American Credentials
Each credential is independently reviewed before it’s awarded · last reviewed Jun 9, 2026. How this is verified →
Financial summary
- Revenue FY2012
- $14.3B
- Net income
- $6.8B
- Total assets
- $212.7B
- Market cap
- $179.0B
- Operating margin
- 32.1%
- Net margin
- 20.7%
Source: SEC EDGAR · updated Jun 8, 2026
Revenue & profit trend
Financial statements
Income statement
- Revenue
- $25.8B
- Operating expenses
- $19.4B
- Operating income
- $8.3B
- Income tax
- -$802.0M
- Net income
- $5.3B
- EPS (basic)
- $3.31
- EPS (diluted)
- $3.30
Balance sheet
- Total assets
- $212.7B
- Current assets
- $13.6B
- Total liabilities
- $146.2B
- Current liabilities
- $22.8B
- Shareholders’ equity
- $66.5B
Cash flow
- Operating cash flow
- $12.5B
- Investing cash flow
- -$23.9B
- Financing cash flow
- $13.0B
- Net cash flow
- $1.6B
Statements via Polygon.io (SEC filings)
15-minute delayed · data by Polygon.io
Past year · hover for prices
52-week range
- Market cap
- $179.0B
- P/E ratio
- 27.2
- EPS (diluted)
- $3.3
- Dividend yield
- 2.78%
- Shares outstanding
- 2.0B
- Open
- —
- Day range
- –
- Prev close
- —
- Volume
- —
- IPO date
- Jun 30, 1972
Nextera Energy Inc (NEE) Stock Price
- Profitable — net income of $6.8B in FY2012.
- Revenue grew 52% from FY2020 to FY2025.
- Trading 8% below its 52-week high.
- Pays a dividend yielding about 2.78% annually.
- Valued at a price-to-earnings (P/E) ratio of 27.2.
Automatically generated from public filings and market data. Informational only — not investment advice or a recommendation to buy or sell any security.
No reviews yet. Be the first to review NEXTERA ENERGY INC.
Write a review
News about NEXTERA ENERGY INC
News & sentiment via Polygon.io
Nextera Energy Inc: frequently asked questions
Is Nextera Energy Inc an American company?
Yes — Nextera Energy Inc is an American company headquartered in Juno Beach, Florida. Its American-origin credentials have been independently reviewed and verified by americancompanies.com.
Where is Nextera Energy Inc headquartered?
Nextera Energy Inc is headquartered in Juno Beach, Florida, United States.
Is Nextera Energy Inc publicly traded?
Yes — Nextera Energy Inc is a publicly traded company. Its stock trades under the ticker symbol NEE on the NYSE.
What does Nextera Energy Inc do?
Nextera Energy Inc is an American Utilities company in the Energy & Utilities sector.